3PhaseInsight

Leverage Insights                                        from 3-Phase Meter Data

Digitalization can accelerate the green transition by bridging delays from slow conventional grid reinforcements. What if the DSO could ‘simply’ reconfigure the existing meters to deliver 3-phase data and, based on this data, immediately deploy solutions that increase their locally available grid capacity?

Project Outcomes

  • Data apps – showcase specific insights generated from the dataset
  • Data pipelines and solution candidates – build on data apps to offer tailored value for customers, DSO planner or electricians
  •   3PhaseInsight open-source platform for scaling data apps and pipelines to real-world applications


Project background

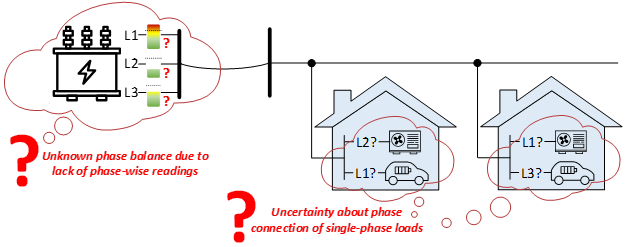
Electrification puts pressure on the distribution grid, which needs more hosting capacity. With the rapid increase of single-phase connected devices, such as heat pumps and low-power EV chargers, phase imbalance and harmonic distortion is becoming even more problematic. DSOs typically do not have information about total harmonic distortion levels, in particular not on per-phase granularity, which complicates the localization of their sources.


The 3PhaseInsight project addresses this by using three-phase measurement data from existing smart meters. By reducing phase imbalance and harmonic distortion, grid capacity can be optimized without heavy infrastructure investments.

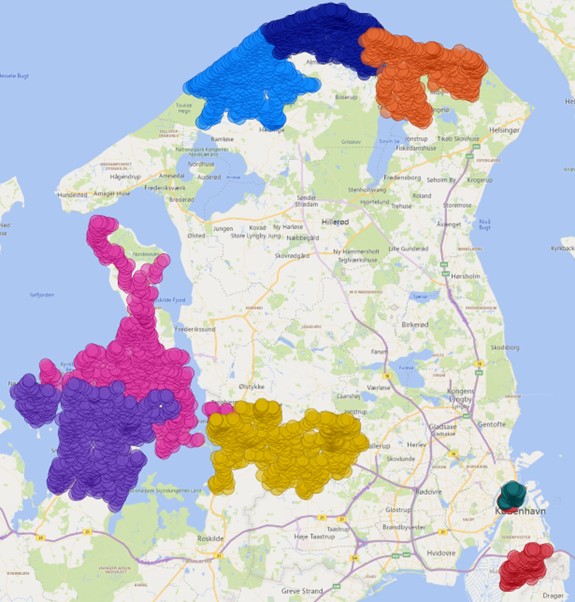
The project will test these solutions on real customer data from across Zealand, evaluating their benefits for grid operations, customers, and society through lower costs and greater renewable integration.


The Challenge of Unknown Phases

In low-voltage grids, many households and devices are connected without clear information about which phase (L1, L2, or L3) they belong to. Without phase-wise measurements, utilities face uncertainty about load balance at the transformer and the exact phase connection of single-phase loads. This lack of visibility can lead to imbalances, reduced efficiency, and difficulties in planning or troubleshooting the network.

Data from 100,000 smart meters

One barrier for the efficient use of existing grid capacity is that DSOs lack three-phase observability. A fundamental building block for enabling these insights and solutions is the reconfiguration of existing smart meters to deliver individual phase measurements for each customer.

An unprecedented large, unique data set was created by the project partner Radius in a large-scale campaign reconfiguring 100,000 already installed smart meters to record such three-phase measurements to enable deep-insight.

No project before has had the opportunity to deliver such robust insights on three phase data value and reported on such a large comparable data set.


The map shows the distribution of smart meters examined, revealing key information across different area types in the Danish distribution grid

20. January 2026

20. August 2025

01. October 2024

03. September 2024

Project Work Packages

Work package 1

Project and Innovation Management

Task 1.1: Coordinating activities across partners 

Task 1.2: Managing the internal innovation process, including use case development and data pipeline design

Task 1.3: Overseeing dissemination, stakeholder engagement, and final reporting

Task 1.4: Delivering strategic insights through public reports 

Deliverables:

  • D1.1: Use cases for data apps and data pipelines
  • D1.2: Opportunities for three-phase data from smart meters and exemplary solutions

WORK PACKAGE 2

Data Platform

Task 2.1: Provide project internal access to a range of agreed three-phase data sets

Task 2.2: Develop API integration for Energydata.dk to securely transfer the agreed data sets

Task 2.3: Enable continued data set updates suppoert WP3 during data screening and data app prototyping

Task 2.4: Develop data model abstraction for data pipeline

Deliverables:

  • D2.1: Data Specification (internal)
  • D2.2: Data Infrastructure Description

WORK PACKAGE 3

Data Apps and Analytics

Task 3.1: Contribute to the identification of data app algorithms and feasibility of data pipeline design

Task 3.2: Development and implementation of data app algorithms

Task 3.3: Produce quantitative results on data app performance on three-phase data set

Deliverable:

WORK PACKAGE 4

Solution Data Pipeline

Task 4.1: Develop complete solution data pipelines scalable to 100.000 meters.

Task 4.2: Concept for scaling solution to 1.5 mio meters

Task 4.3: Showcase end-user application based on data pipleline outcome

Task 4.4: Showcase pipeline applicability to two database environments

Task 4.5: Release data pipeline as open source solution

Deliverables:

  •  D4.1: 

    Results of data pipeline applications showcase

  •  D4.2: 

    Data pipeline source code

Services


Service solutions will be built as specific configurations of the data pipeline, based on INILAB’s data architecture, DTU’s data apps, and validated using data from Radius’ grid and smart meters. Each solution is designed to highlight different stakeholder perspectives: technicians, customers and operators of low-voltage distribution networks.


Service 1

Phase Connection Assistant

  • Delivers actionable, data-driven guidance directly to electricians at the point of installation
  • Recommends the optimal phase for new single-phase devices (heat pumps, EV chargers) based on live grid data
  • Reduces phase imbalance by distributing new loads intelligently across phases
  • Prevents overloading of already-stressed phases, improving hosting capacity

Service 2

Smart meter connection issue report

  • Detects problematic meter connections: phase twists, doubled-phase links, and wrong feeder associations
  • Improves accuracy of LV grid models, which underpin planning and power-flow calculations
  • Reduces costly manual field verification by flagging suspected anomalies in advance
  • Supports a clear workflow from data-team review through to operational decision-making

Service 3

Phase imbalance screening

  • Ranks feeders and line sections by severity and persistence of phase imbalance across the LV grid
  • Visualises problem areas so planning teams can quickly identify where intervention is most needed
  • Focuses mitigation resources — re-phasing, reinforcement, connection guidance where impact is greatest
  • Helps reduce thermal stress and voltage quality issues caused by persistent imbalance

Service 4

Customer issue diagnosis and reporting

  • Translates complex grid analytics into plain customer-facing explanations of fuse trips, imbalance, or power quality issues
  • Equips field technicians with a targeted issue summary, enabling faster and more efficient on-site visits
  • Reduces complaint-driven investigations by enabling proactive diagnosis before customers report problems

Service 5

Customer fuse loading assistant

  • Supports electricians in recommending or implementing corrective installation changes based on real loading data
  • Sends automated alerts when a customer's fuse experiences recurring high loading — before an outage occurs
  • Shows when and how frequently overloading happens, giving customers and electricians actionable context

Service 6

Per-phase hosting capacity analysis

  • Accelerates connection approval decisions by giving planners a data-backed per-phase feasibility view
  • Quantifies exactly how much additional load or DER can be added per phase without violating operational limits
  • Goes beyond traditional balanced planning by accounting for real phase-specific constraints from smart-meter data

Service 7

Per-feeder imbalance assessment

  • Characterises imbalance at the substation, feeder, or cabinet level, not just across the whole grid
  • Captures both severity and duration of imbalance to distinguish chronic issues from transient spikes
  • Drills down to specific locations with persistent problems, supporting root-cause identification

Service 8

Phase imbalance mitigation

  • Supports operations teams in scheduling and prioritising corrective work across the network
  • Directly targets reduction of losses and prevention of overloads caused by persistent phase imbalance
  • Recommends specific balancing actions such as re-phasing connections or adjusting operational setpoints
  • Categorises identified imbalance issues and generates concrete, actionable mitigation suggestions per feeder or node

Service 9

Per-phase load profile generation

  • Generates representative per-phase load profiles for selected load types and aggregation levels
  • Flexible configuration by load category (residential, EV, heat pump, etc.) and aggregation granularity
  • Outputs are ready to export and use directly in planning studies or simulation tools

Service 10

Residential load disaggregation

  • Breaks down a household's total consumption by estimated appliance type, without requiring smart plugs or sub-metering
  • Gives customers direct visibility into their main consumption drivers: heating, EV charging, appliances, etc
  • Enables energy advisers to propose targeted efficiency or behavioural measures based on actual usage patterns

Service 11

Phase-aware smart charging

  • Adapts EV charging behaviour in real time based on per-phase loading conditions in the local grid
  • Increases the number of EVs that can be accommodated on existing infrastructure without reinforcement
  • Reduces peak loading and improves phase balance by intelligently shaping charge profiles
  • DSO provides phase-level signals to EVSE operators, enabling coordinated and grid-aware charging

Service 12

Delivery point hosting capacity information

  • Provides per-phase hosting capacity figures at individual delivery points
  • Supports informed investment decisions by revealing grid constraints before planning or procurement begins
  • Enables building owners and developers to quickly assess whether new loads or DERs can be added at their connection point

Project Team

Partner Representatives

  • Daniel Frederiksen (INILAB)
  • Carsten Buhl Nielsen (Radius)

Project Lead

Kai Heussen

Kai Heussen Senior Researcher

Consortium

Workshop